
 The City of Paramount is participating in the Governor’s Initiative AmeriCorps CivicSpark Fellowship Program where recent college graduates known as “Fellows” are assigned to various communities to help build capacity in sustainability, water issues, and community engagement. The City worked with CivicSpark Fellow Christy Liang to produce a Community Greenhouse Gas (GHG) Inventory Report.
In its continued efforts toward sustainability, Paramount felt that a GHG Inventory would be a beneficial first step toward the development of a Climate Action Plan, or a more concerted effort by staff to develop further sustainable policies and procedures. This would lead to policies implemented not only on an administrative level but also on a community level. Although Paramount has, through the years, undertaken several sustainable practices as part of its operations, having a GHG Inventory creates a starting off point that allows staff to make specific changes in an effective and efficient manner.
What is a Greenhouse Gas Inventory?
Greenhouse gases are gases that trap heat in the Earth’s atmosphere. Some examples of greenhouse gasses include carbon dioxide, methane and nitrous oxide. According to the United States Environmental Protection Agency, carbon dioxide enters the atmosphere through burning fossil fuels (coal, natural gas, and oil), solid waste, trees and other biological materials, and also as a result of certain chemical reactions (e.g., manufacture of cement). Carbon dioxide is removed from the atmosphere (or “sequestered”) when it is absorbed by plants as part of the biological carbon cycle. A GHG Inventory estimates the quantity of GHG emissions associated with five specific areas of community energy-use sources and activities taking place during a chosen analysis year. What a GHG Inventory does not measure is the emissions of other industrial emissions like heavy metals
How Is It Created?
The creation of a community GHG Inventory requires the gathering of emission data from a minimum of five energy sectors. These sectors are:
- Grid Electricity
- Stationary Fuel Combustion
- Transportation
- Solid Waste
- Water & Wastewater
Once all the data has been received, a tracking tool is used to calculate and create the resulting inventory for analysis.
Key Findings
After compiling all the data provided to the City from the various energy sectors, the inventory was created and placed in a pie chart to make it easier to understand. The pie chart demonstrates how the five different sectors compare to each other and the percentage they make up of overall emissions. In Paramount’s 2017 GHG Inventory, the two largest emission sectors are transportation at 40% and the industrial, also at 40% of total emissions. This is consistent with the size of Paramount’s business sector and its location regionally.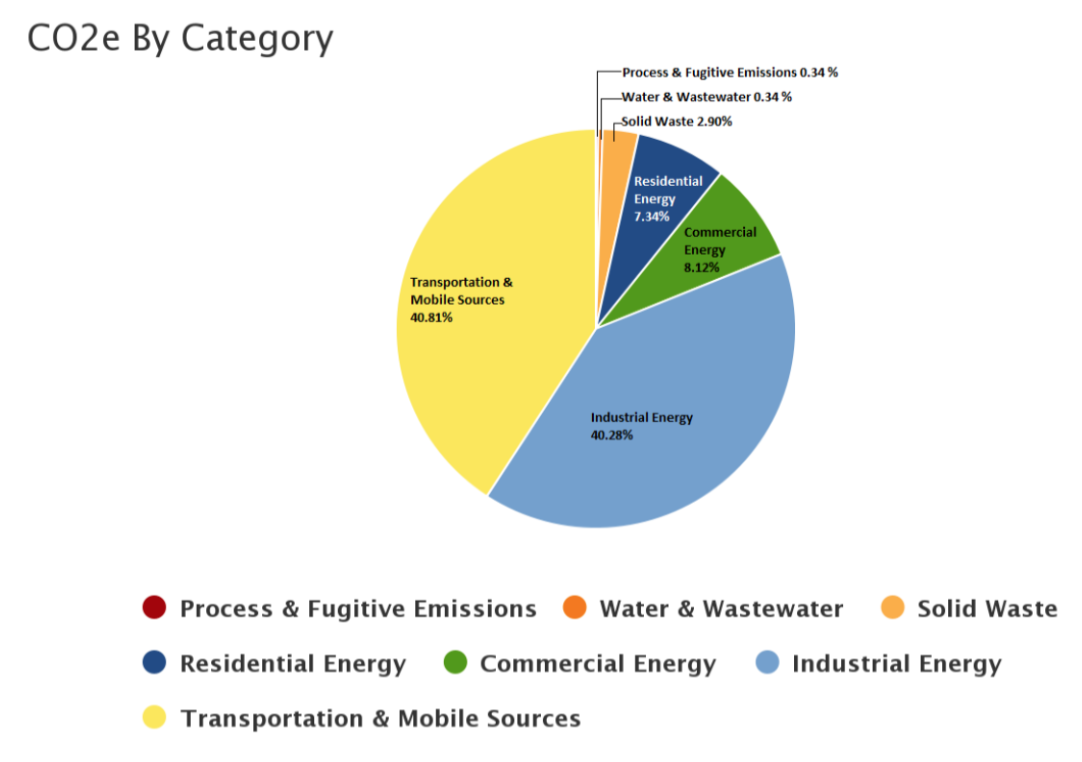 Moving Forward
How the City decides to move forward with the GHG Inventory will depend on prioritizes based on cost, effectiveness, feasibility, and support from the community. Most importantly, it will be the formation of an emissions reduction target that the City will commit to through the creation of new policies and procedures, a Climate Action Plan, or both.
To read the full Community Greenhouse Gas Inventory Report, click or tap here. See pages 299-328.

Comments are closed.